The Report in the Backlog
I have wanted to create a personal annual report for several years. It sat on my backlog through multiple planning systems.
It finally became one of my July builds for a challenge I call The Ship Monthly Challenge: create something meaningful every month and get it out of the backlog.
The idea was simple: collect the traces of a year and turn them into something worth keeping. Where did I go? How did I spend my time? What changed in my health? What did I make? What held steady?
My data was scattered across health exports, calendars, photos, GitHub, Strava, Spotify, spreadsheets, and the AI tools I use. Each source had its own format, gaps, and definition of a day. Collecting the files was possible. Making honest claims across them was a different problem.
So the project stayed on the list.
The Felton Reports
The original inspiration was Nicholas Felton's Personal Annual Reports. From 2005 through 2014, Felton used the details of his own life as material for a series of carefully designed reports.
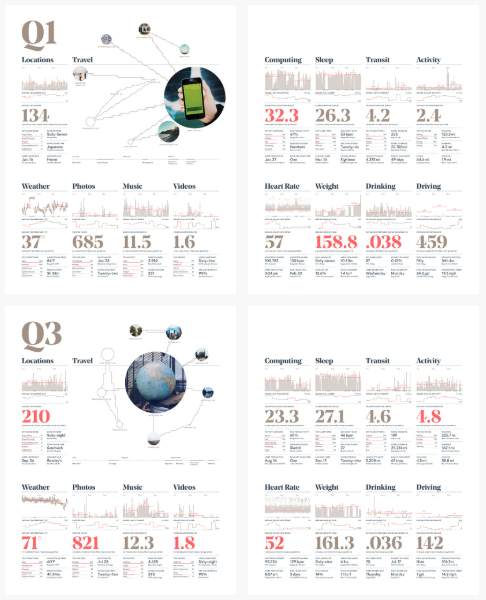
What stayed with me was not the volume of data. It was the editorial treatment. The reports made personal information feel considered. They were neither corporate dashboards nor exhaustive activity logs. They used data to describe a life.
That distinction matters. Most personal tracking products are built to change today's behavior. Close the ring. Maintain the streak. Hit the target. An annual report asks a slower question: what happened here?
The Appeal of the Quantified Self
The quantified-self movement gave a name to something I was already inclined to do: use personal data to notice patterns that memory smooths over.
Memory is selective. It overweights recent events and turns gradual changes into vague impressions. A project can feel all-consuming when it occupied only one intense month. A health change that seemed sudden may have taken most of the year.
Data does not remove subjectivity, and I would not want it to. The point is not to reduce a year to measurements. The point is to put evidence beside memory and see where they agree.
Why It Stayed on the Backlog
I underestimated the work between having data and being able to use it.
My Apple Health export alone contains 3.68 million records across 11.6 years. Photos carry time and location, except when they do not. Calendar entries describe intended time, not necessarily lived time. GitHub records visible contribution activity but misses work that happened elsewhere. Two devices can measure the same thing differently. Across 2,146 days when both an iPhone and Apple Watch counted steps, the phone reported roughly one-third less at one end of the distribution and three times more at the other.
A polished chart can hide all of that. That is the danger.
I could build each part. I could not justify spending months connecting and maintaining all of them for a personal project.
What AI Changed
AI changed the economics of the project.
It did not make the data cleaner or the decisions obvious. It made sustained implementation practical. I could describe an architectural problem, test an approach, inspect the result, reject weak abstractions, and revise without paying the full coordination cost each time. Work that once required a long uninterrupted block could move forward in smaller sessions without losing all of its context.
My view is now fairly direct: AI is most useful on long-standing projects where the desire already exists but the cost of execution keeps winning. It does not need to invent the idea. It needs to make the idea affordable to pursue.
The Rule That Keeps It Honest
Using AI to build a report about personal data creates an obvious problem. A language model can produce a convincing story before it has earned one.
The project has a rule for that: the model may write the query; it may not write the answer.
AI can propose a comparison, correlation, trend, or grouping. The number must come from an operation executed against the actual records. Every result carries its coverage. A correlation over four days is still a bad finding, even if the arithmetic is correct. A missing measurement is not zero. “Busiest month,” “farthest trip,” and “more than last year” are calculations, not turns of phrase.
This has made the project more rigorous than I expected. It also made it more interesting. The goal is not automated autobiography. The system does the mechanical work needed to support a claim. I still decide which questions matter, what belongs in the report, what stays private, and what the period meant.
What the Project Became
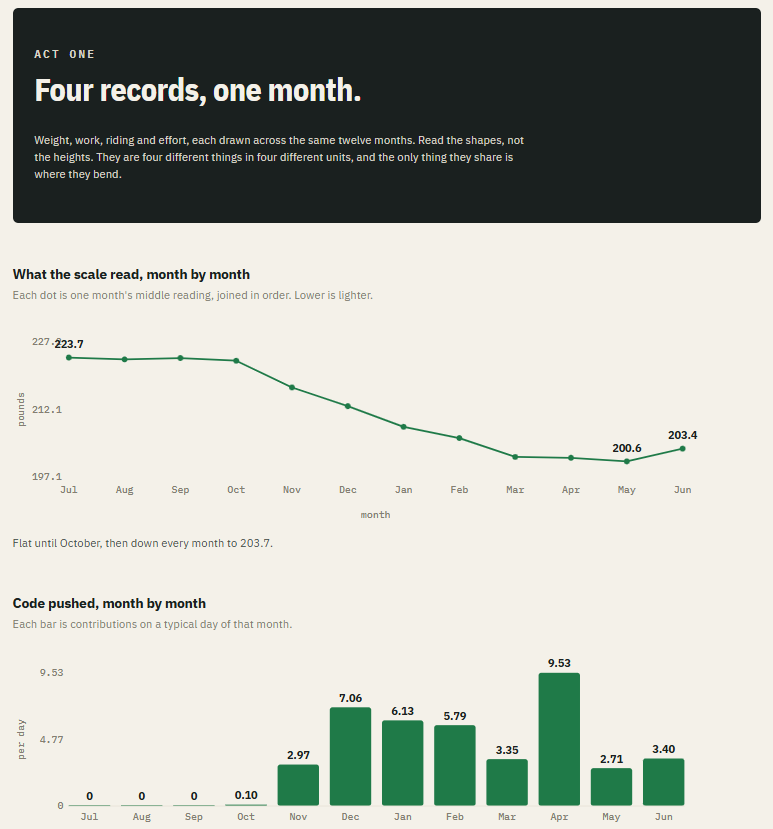
The annual report is taking shape as an editorial sequence, not a dashboard. This section of the rolling report puts changes in weight and GitHub activity under one claim instead of presenting them as unrelated metrics.
Building the report led to a broader personal data platform. It collects source-faithful observations, converts them into common forms, aligns them on a daily timeline, and lets a report ask grounded questions of the result. The report is the first use, but it is no longer the whole system.
That expansion was partly good architecture and partly the familiar temptation to build infrastructure before finishing the thing that inspired it. I am aware of the irony.
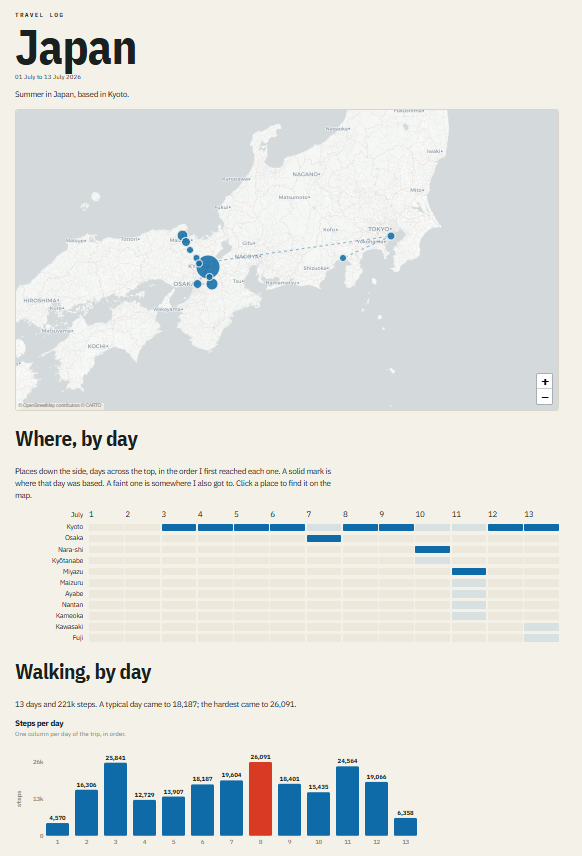
The platform now handles health, photos, GitHub, calendars, Strava, Spotify, and LLM activity. It keeps source data local, labels sensitive fields, and rebuilds derived data when the inputs or rules change. The same observations can support a different experience, such as this travel log from Japan.
Making the Backlog Real
The project is done, although the report will keep changing as the archive grows. The data platform has been rebuilt, the report has been rendered against it, and the source coverage is much stronger.
It has moved from a recurring idea to working software and a body of personal data I can ask questions of without pretending the answers are cleaner than they are. I also published the reusable project to GitHub so the work is not trapped inside one edition.
That is what AI enabled for me. Not a one-click report. Not instant insight. It reduced enough of the implementation burden that I could finally do the patient work the idea required.
I suspect many worthwhile AI projects look like this. They are already sitting on someone's backlog, understood well enough to matter and too expensive to justify. The opportunity is not always to imagine something new. Sometimes it is to revisit the thing you have wanted to make for years and ask whether the cost has changed.